iCAP6300全谱直读垫高耦合等离子体原子发射光谱仪(美国热电公司);Elix纯水机。
ICP-AES最佳工作条件:射频功率为1200 W;辅助气(Ar)流量为1.0 L/min;雾化器压力为0.24 MPa;蠕动泵泵速为55 r/min;观察高度为11.6mm;检测时间为30 s。
镍标准储备溶液:1 mg/mL,称取0.500 0 g金属镍粉(纯度不小于99.99%)于250 mL锥形瓶中,加入25 mL 硝酸加热溶解完全,冷却,转移到500 mL容量瓶中,定容,摇匀。 铜标准储备溶液:1 mg/mL,称取0.500 0 g金属铜粉(纯度不小于99.99%)于250 mL锥形瓶中,加入25 mL 硝酸加热溶解完全,冷却,转移到500 mL容量瓶中,定容,摇匀。 铝标准储备溶液:1 mg/mL,称取0.500 0 g金属铝(纯度不小于99.99%)于250 mL锥形瓶中,加入50 mL盐酸(1+1)加热至溶解完全,冷却,转移到500 mL容量瓶中,定容,摇匀。
铁标准储备溶液:1 mg/mL,称取0.500 0 g金属铁粉(纯度不小于99.99%)于250 mL锥形瓶,加入50 mL硝酸(1+1)加热至溶解完全,冷却,转移到500 mL容量瓶中,定容,摇匀。
HCl、HNO3、H2SO4均为优级纯;高纯五氧化二钒(质量分数大于99.99%)。
实验用水为二次蒸馏水。

图1 Al 309.271nm光谱干扰 图2 Ni 361.939 nm光谱干扰
Fig.1 Spectral interference of Al 309.271 nm Fig.2 Spectral interference of Ni 361.939 nm 多数灵敏度较高分析谱线未受基体钒、硫光谱干扰,如Al 396.152 nm和Ca 183.801 nm等,钒和硫在谱线窗口内无谱峰,而且信号基线平直,见图3和图4。

图3 Al 396.152nm光谱干扰 图4 Ca 317.933nm光谱干扰
Fig.3 Spectral interference of Al 396.152nm Fig.4 Spectral interference of Ca 317.933nm 从未受钒、硫光谱干扰且灵敏度较高的谱线中选择待测元素分析谱线,分析谱线及背景校正位置见表1。
表1 元素分析谱线和背景校正位置
Table 1 The element analysis wavelength and the background correct position
|
元素 Element |
波长 Wavelength /nm |
左背景校正点 Left background correction point(pixel) |
右背景校正点 Rihgt background correction point(pixel) |
积分区域中心位置 Integral regional center position (pixel) |
积分测量区域宽度 Integral measurement area width(pixel) |
|
Ca |
317.933 |
2 |
11 |
7 |
2 |
|
Mg |
285.213 |
1 |
10 |
6 |
2 |
|
Ni |
211.647 |
1 |
11 |
6 |
2 |
|
Cu |
324.754 |
1 |
12 |
6 |
2 |
|
Al |
396.152 |
1 |
11 |
6 |
2 |
|
Fe |
238.204 |
2 |
11 |
6 |
2 |

图5 Fe 239.562 nm基体效应 图6 Ni 221.647 nm基体效应
Fig.5 Matrix effect of Fe 239.562 nm Fig.6 Matrix effect of Ni 221.647 nm
表2 钒基体连续背景叠加影响影响试验
Table 2 The vanadium base continuous background superposition impact test
|
元素 Element |
不含钒基体溶液 The matrix solution not containing vanadium |
1.6mg/mL钒基体溶液 The substrate solution containing 1.6mg / mL of vanadium |
||||
|
信号强度 Signal intensity |
背景强度 Background intensity |
信号净强度 Net signal intensity |
信号强度 Signal intensity |
背景强度 Background intensity |
信号净强度 Net signal intensity |
|
|
Ca |
6494.85 |
271.21 |
6223.64 |
7495.5 |
448.97 |
7046.53 |
|
Mg |
44322.31 |
148.12 |
44174.19 |
47485.47 |
511.7 |
46973.77 |
|
Ni |
3106.48 |
117.88 |
2988.60 |
3139.71 |
115.26 |
3024.45 |
|
Cu |
8672.10 |
493.99 |
8178.11 |
9336.88 |
492.42 |
8844.45 |
|
Al |
4800.67 |
744.14 |
4056.53 |
5025.79 |
815.54 |
4210.26 |
|
Fe |
5672.49 |
75.06 |
5597.43 |
6005.22 |
78.14 |
5927.09 |
在仪器最佳工作条件下测定空白溶液,计算方法的背景等效浓度(BEC);同时对空白溶液连续测定11次,以3倍标准偏差计算方法中各待测元素的检出限,结果见表3
表3 线性方程、相关系数、背景等效浓度以及检出限
Table 3 The linea equation,correlation coefficient,background equivalent density and detection limit
|
元素 Element |
线性方程 Linear equation |
相关系数 Correlation coefficient |
BEC/% |
检出限 Detection limit/% |
|
Ca |
y=58878 x+646.77 |
0.999 11 |
-0.0001 |
0.0003 |
|
Mg |
y=124343 x-264.18 |
0.999 70 |
-0.0002 |
0.0002 |
|
Ni |
y=28996 x-9.5928 |
0.999 98 |
0.0000 |
0.0001 |
|
Cu |
y=60043 x-70.304 |
0.999 97 |
0.0004 |
0.0001 |
|
Al |
y=37601 x+40.788 |
0.999 96 |
0.0001 |
0.0003 |
|
Fe |
y=37717 x+56.353 |
0.999 17 |
-0.0001 |
0.0001 |
表4 硫酸氧钒样品测定结果 (n=8)
Table 4 Determination results of vanadium sulfate sample
|
元素 Element |
样品1 Sample 1 |
样品2 Sample 2 |
||||
|
测定值 Found w/% |
SD w/% |
RSD/%
|
测定值 Found w/% |
SD w/% |
RSD/%
|
|
|
Ca |
0.0054 |
0.00023 |
4.2 |
0.0008 |
0.00008 |
9.4 |
|
Mg |
0.0015 |
0.00005 |
3.1 |
0.0007 |
0.00006 |
9.0 |
|
Ni |
0.0016 |
0.00012 |
7.6 |
0.0012 |
0.00007 |
6.0 |
|
Cu |
0.0007 |
0.00007 |
10 |
0.0003 |
0.00005 |
14 |
|
Al |
0.0048 |
0.00012 |
2.6 |
0.0009 |
0.00005 |
6.3 |
|
Fe |
0.0038 |
0.00019 |
4.9 |
0.0035 |
0.00024 |
6.8 |
表5 回收率试验结果
Table 5 Results of recovery test
|
元素 Element |
样品3 Sample 3 |
样品4 Sample 4 |
||||||
|
测定值 Found w/% |
加入量 Added w/% |
测定总值 Total found w/% |
回收率 Recovery /% |
测定值 Found w/% |
加入量 Added w/% |
测定总值 Total found w/% |
回收率 Recovery /% |
|
|
Ca |
0.0042 |
0.0020 |
0.0063 |
103 |
0.0015 |
0.0020 |
0.0036 |
105 |
|
Mg |
0.0041 |
0.0020 |
0.0063 |
110 |
0.0012 |
0.0020 |
0.0030 |
93 |
|
Ni |
0.0001 |
0.0010 |
0.0012 |
108 |
0.0015 |
0.0020 |
0.0034 |
95 |
|
Cu |
0.0009 |
0.0010 |
0.0020 |
102 |
0.0020 |
0.0020 |
0.0038 |
90 |
|
Al |
0.0024 |
0.0010 |
0.0035 |
110 |
0.0022 |
0.0020 |
0.0041 |
96 |
|
Fe |
0.0006 |
0.0010 |
0.0015 |
91 |
0.0006 |
0.0010 |
0.0016 |
100 |
|
元素 Element |
样品5 Sample 5 |
样品6 Sample 6 |
||||||
|
测定值 Found w/% |
加入量 Added w/% |
测定总值 Total found w/% |
回收率 Recovery /% |
测定值 Found w/% |
加入量 Added w/% |
测定总值 Total found w/% |
回收率 Recovery /% |
|
|
Ca |
0.0012 |
0.0010 |
0.0021 |
90 |
0.0010 |
0.0010 |
0.0019 |
90 |
|
Mg |
0.0011 |
0.0010 |
0.0022 |
110 |
0.0015 |
0.0010 |
0.0024 |
90 |
|
Ni |
0.0032 |
0.0030 |
0.0061 |
97 |
0.0023 |
0.0030 |
0.0055 |
107 |
|
Cu |
0.0040 |
0.0030 |
0.0068 |
93 |
0.0042 |
0.0030 |
0.0070 |
93 |
|
Al |
0.0039 |
0.0030 |
0.0069 |
100 |
0.0029 |
0.0030 |
0.0058 |
97 |
|
Fe |
0.0030 |
0.0030 |
0.0059 |
97 |
0.0013 |
0.0030 |
0.0045 |
107 |
表6 分析结果对照试验 (%)
Table 6 Analysis result comparison (%)
|
元素 |
样品5 |
样品6 |
||
|
ICP-OES |
ICP-MS |
ICP-OES |
ICP-MS |
|
|
Ca |
0.0012 |
0.0010 |
0.0010 |
0.0013 |
|
Mg |
0.0011 |
0.0013 |
0.0015 |
0.0016 |
|
Ni |
0.0032 |
0.0035 |
0.0023 |
0.0020 |
|
Cu |
0.0040 |
0.0037 |
0.0042 |
0.0046 |
|
Al |
0.0039 |
0.0043 |
0.0029 |
0.0026 |
|
Fe |
0.0030 |
0.0026 |
0.0013 |
0.0016 |
参考文献: [1] 郑国经.电感耦合等离子体原子发射光谱分析仪器与方法的新进展 [J].冶金分析,2014,34(11):1-10.
ZHENG Guo-jing. New advances in inductively coupled plasma atomic emission spectrometric instruments and methods [J]. Metallurgical Analysis, 2014, 34(11): 1-10.
[2] 成勇.微波消解-电感耦合等离子体原子发射光谱法测定五氧化二钒中痕量硼和铋 [J].冶金分析,2015,35(3):56-60.
CHENG Yong. Determination of trace boron and bismuth in Vanadium pentoxide by microwave digestion- inductively coupled plasma atomic emission spectrometry [J]. Metallurgical Analysis, 2015,35(3):56-60.
[3] 杨新能,冯宗平,羊绍松,等.电感耦合等离子体原子发射光谱法测定钒铁合金中杂质元素 [J]. 冶金分析,2014,34 (11):37-41.
YANG Xin-neng,FENG Zong-ping,YANG Shao-Song,et al.Determination of impurity elements in ferrovanadium alloy by inductively coupled plasma atomic emission spectrometry [J]. Metallurgical Analysis, 2014,34 (11):37-41.
[4] 陶柳佳.电感耦合等离子体原子发射光谱法测定高纯五氧化二钒产品中的杂质元素 [J].化工技术与开发,2013,42(7):48-50,14.
TAO Liu-jia.Determination of impurity elements in high purity vanadium pentoxide byiinductively coupled plasma atomic emission spectrometry [J]. Technology & Development of Chemical Industry, 2013,42(7):48-50,14.
[5] 陈荣庆.粉末压片-X射线荧光光谱法测定五氧化二钒中主次成分 [J]. 冶金分析,2008,28(4):8-12.
CHENG Rong-qing. Determination of major and minor components in vanadic oxide by the poeder press slice-X-ray [J]. Metallurgical Analysis, 2008,28(4):8-12.
[6] 成勇.电感耦合等离子体原子发射光谱法测定五氧化二钒中19种杂质元素 [J].理化检验:化学分册,2009,45(1);82-84.
CHENG Yong. ICP-AES Determination of 19 impurity elements in vanadium pentoxide [J]. Physical Testing and Chemical Analysis Part B:Chemical Analysis, 2009,45(1):82-84.
[7] 郑敏辉.电感耦合等离子体原子发射光谱法测定铝工业用晶料细化剂中铝铁锰 [J].冶金分析,2015,35(2):57-60.
ZHENG Min-hui. Determination of aluminum, iron and manganese in grain refiner used in aluminum industry by inductively coupled plasma atomic emission spectrometry [J].Metallurgical Analysis, 2015,35(2):57-60.
[8] 高颂,庞晓辉,梁红玲.电感耦合等离子体原子发射光谱法测定TG6钛合金中镁钒铬铁钴铜锰钨 [J].冶金分析,2015,35(3):51-55.
GAO Song,PANG Xiao-hui,LIANG Hong-ling.Copper,manganese,molybdenum and tungsten in TG6 titanium alloy by inductively coupled plasma atomic emission spectrometry [J]. Metallurgical Analysis, 2015,35(3):51-55.
[9] 李韶梅,王国增,赵军,等.电感耦合等离子体原子发射光谱法测定铌铁中铌和钽 [J].冶金分析,2012,32(3):48-50.
LI Shao-mei,WANG Guo-zeng,ZHAO Jun,et al. Determination of niobium and tantalum in ferroniobium by inductively coupled plasma atomic emission spectrometry [J]. Metallurgical Analysis, 2012, 32(3): 48-50.
[10] 庞昌信,李燕发. ICP-AES法测定铌铁合金中的3种元素 [J].有色金属分析通讯,2003,6(3):10-11.
PANG Chang-xin,LI Yan-fa.Determination of 3 elements in ferrocolumbium by ICP-AES[J].Communication analysis of nonferrous metals,2003,6(3):10-11.
(作者:攀钢集团研究院有限公司,钒钛资源综合利用国家重点实验室,成 勇)

2022-02-24 15:05:40
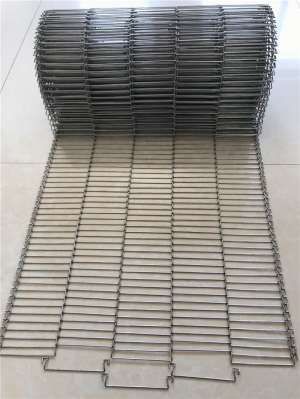
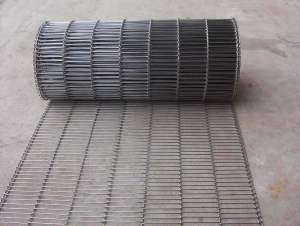
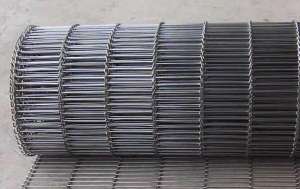
网带的作用和优点。运用金属网带能够停止碎散的物料的保送,出来一颗保送散碎的物料...

2022-01-20 16:25:44
网带的用途网带主要应用于食品烘干机、蔬菜、海产品清洗灭菌机,巴氏杀菌机...
2021-12-22 16:08:38
网带的种类曲轴型网带标注法集中了金属丝编织网带的各种优点,由于具有弯曲...
2021-09-02 16:47:00
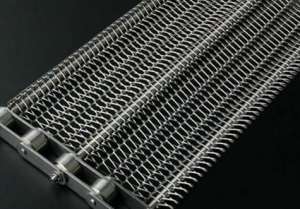
扬州乙型网带制造厂,乙型网带温度注意环境乙字型网带又称乙型网带或食品网带,巧克力网带,在应用方面主要...
2021-07-15 14:59:56
在使用乙型网带时要关注温度环境乙字型网带又称乙型网带或食品网带,巧克力网带,在应用方面主要...
2021-07-07 22:10:07
不锈钢网带断丝原因及解决办法不锈钢网带有必定的结实性,但是在实践运用过程中也会发作断丝的...